Excel Pivot Table
A Pivot Table is used to summarize, sort, reorganize, group, count, total, or average data stored in a table. It allows us to transform columns into rows and vice versa. It will enable grouping by any field (column) and using advanced calculations on them.
In short, Pivot can:
-
group items/rows into categories
-
count the number of items in each category,
-
sum the value of the item
-
or compute an average, find the minimum or maximum value, etc.
Default COMET Pivot
The default COMET Pivot feature is available for these reports:
-
Persons
-
Person Registrations
-
Person Contracts
-
-
Organizations
-
Organizations
-
-
Events
-
Event Participants
-
-
Competitions
-
Competitions
-
Competition Person Registrations
-
Matches
-
Player Appearances
-
Team Official Appearances
-
Match Official Appearances
-
Match Events
-
-
Licensing
-
Applications
-
Application Categories
-
Application Evidence
-
-
Disciplinary
-
Disciplinary Sanctions
-
-
Users
-
User roles
-
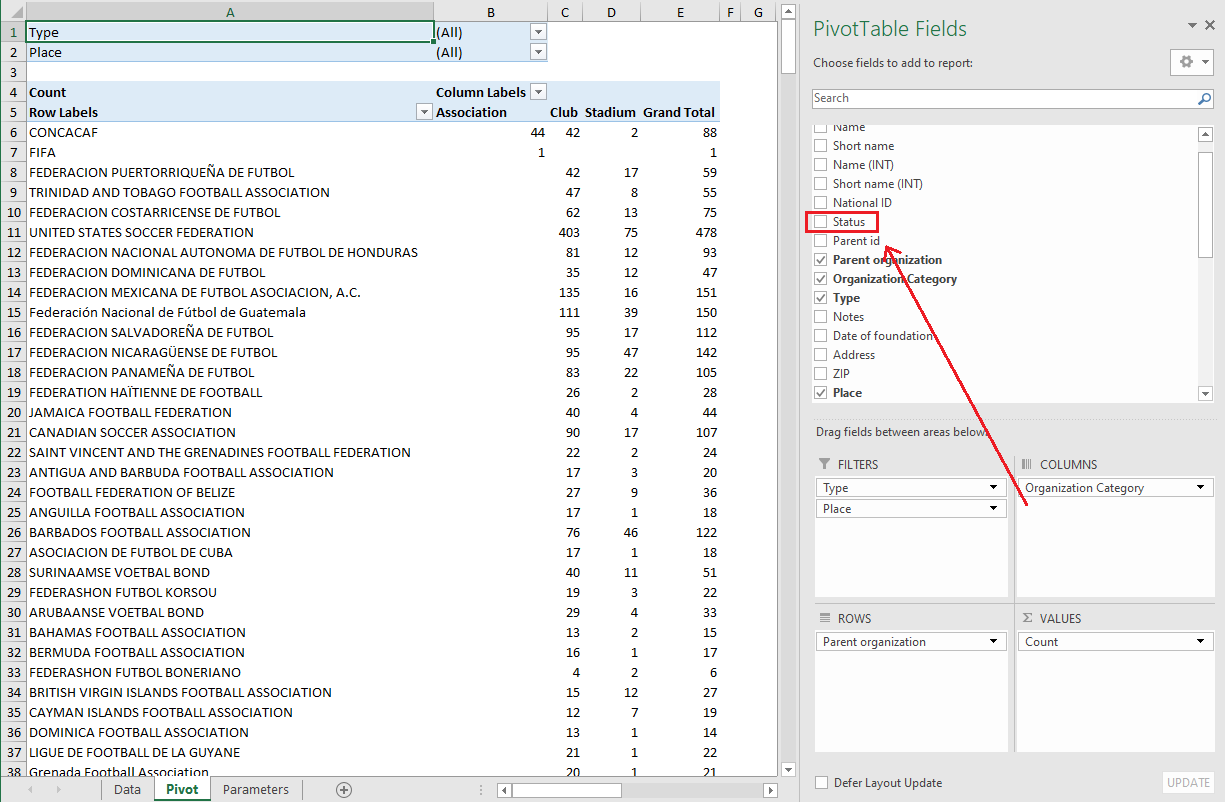
- Step 1: Export the Organizations report, open it in Excel, and open the Pivot tab
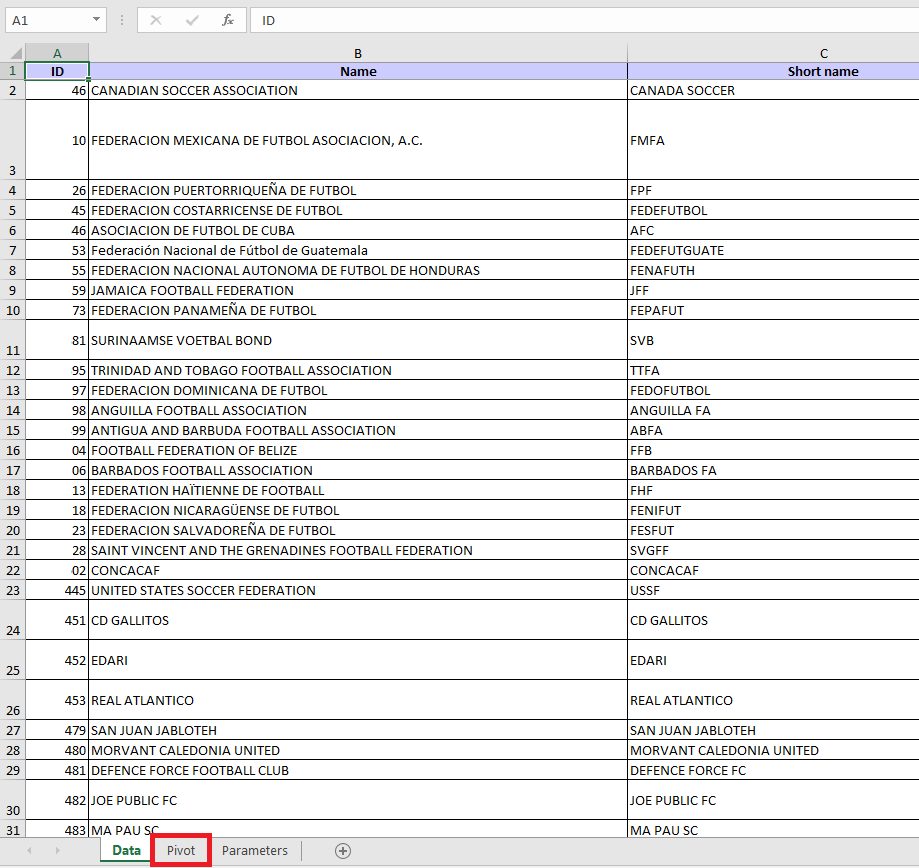
- Step 2: Use the information from the default Pivot
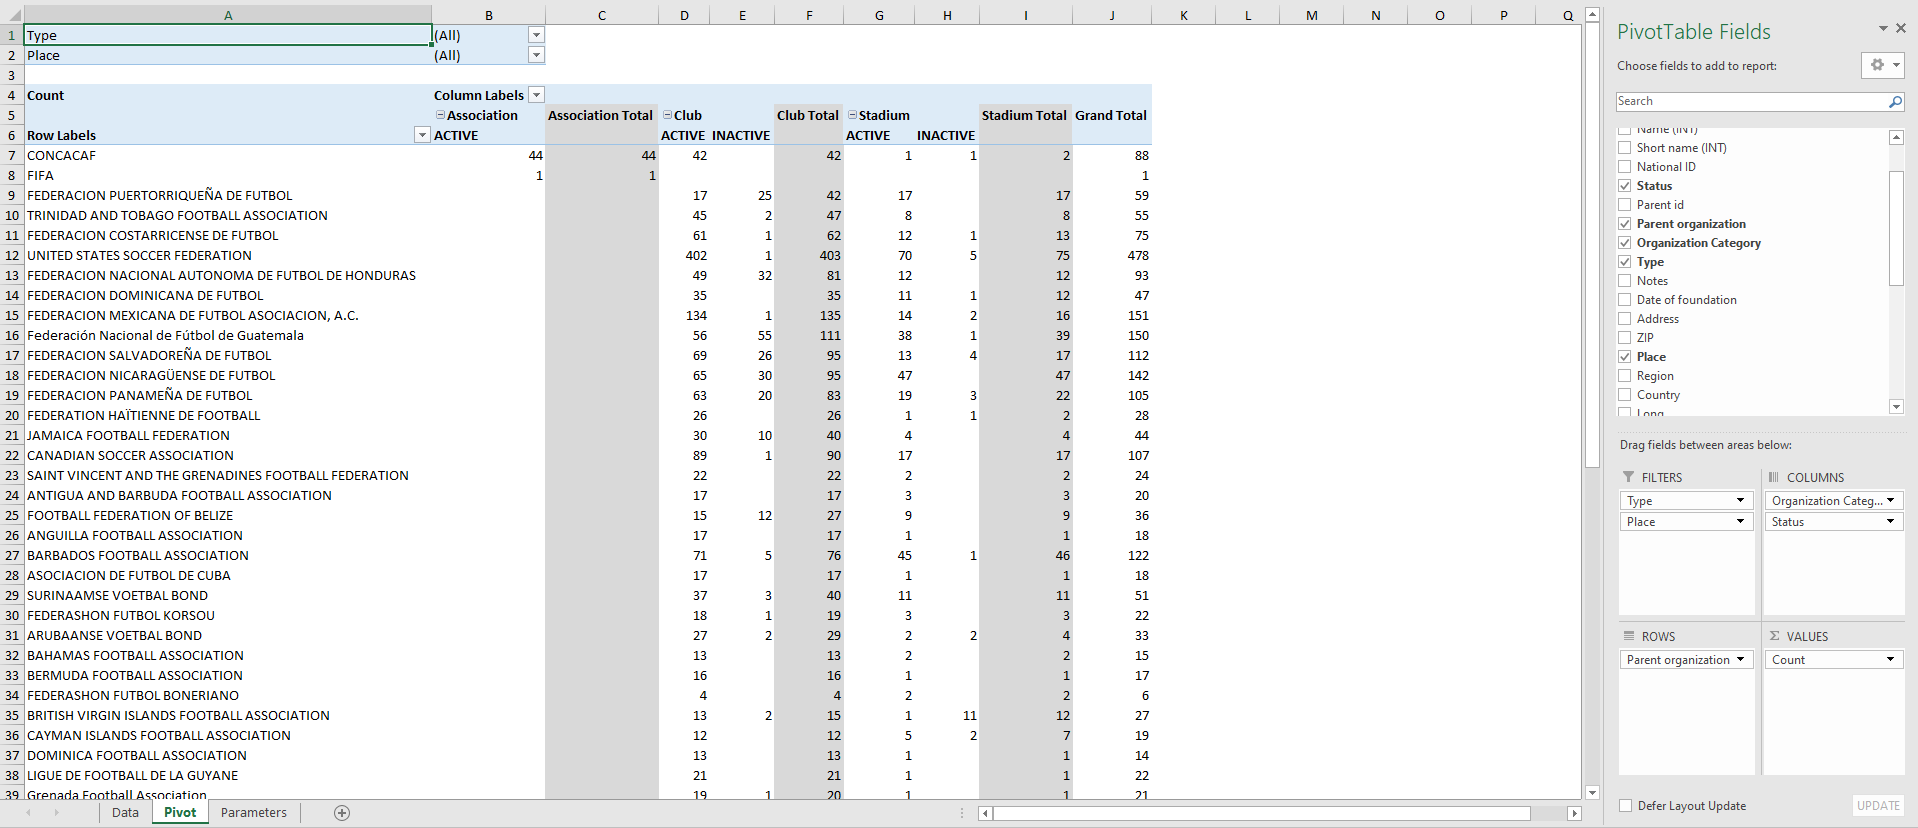
- Step 3: If you need a more advanced report, drag & drop PivotTable fields from or to any area (filters, columns, rows, or values)
Advanced COMET Pivot Example
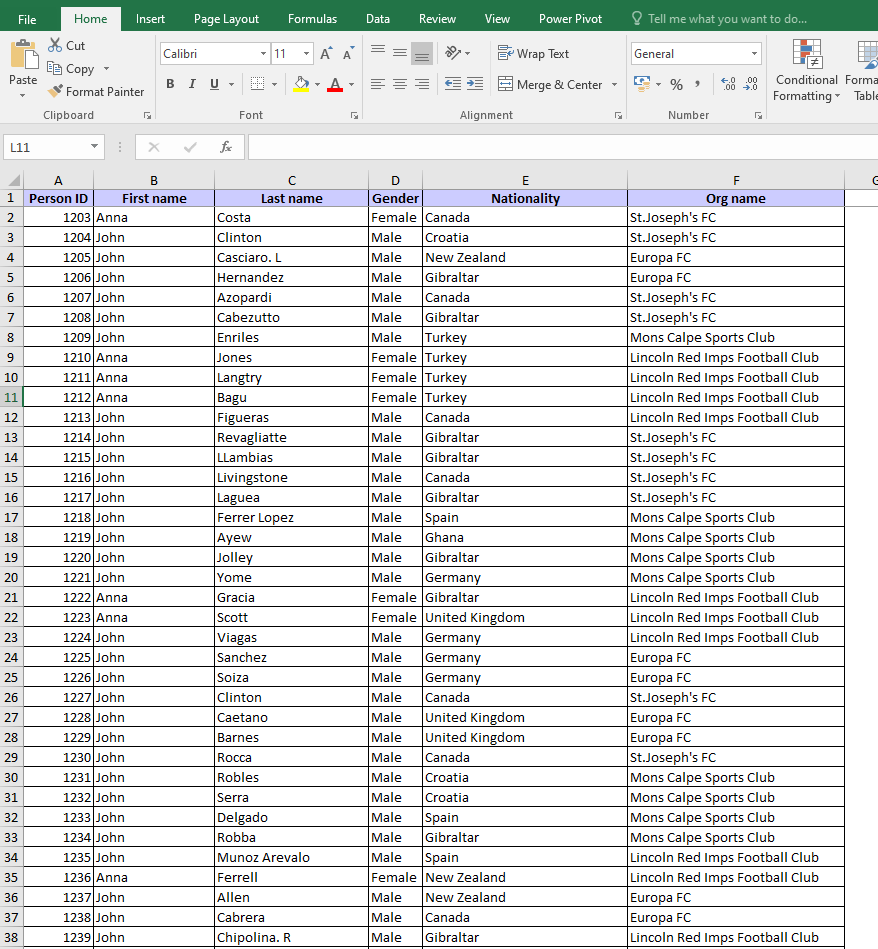
For example, you want to know how many confirmed players are registered in your Association by nationality.
-
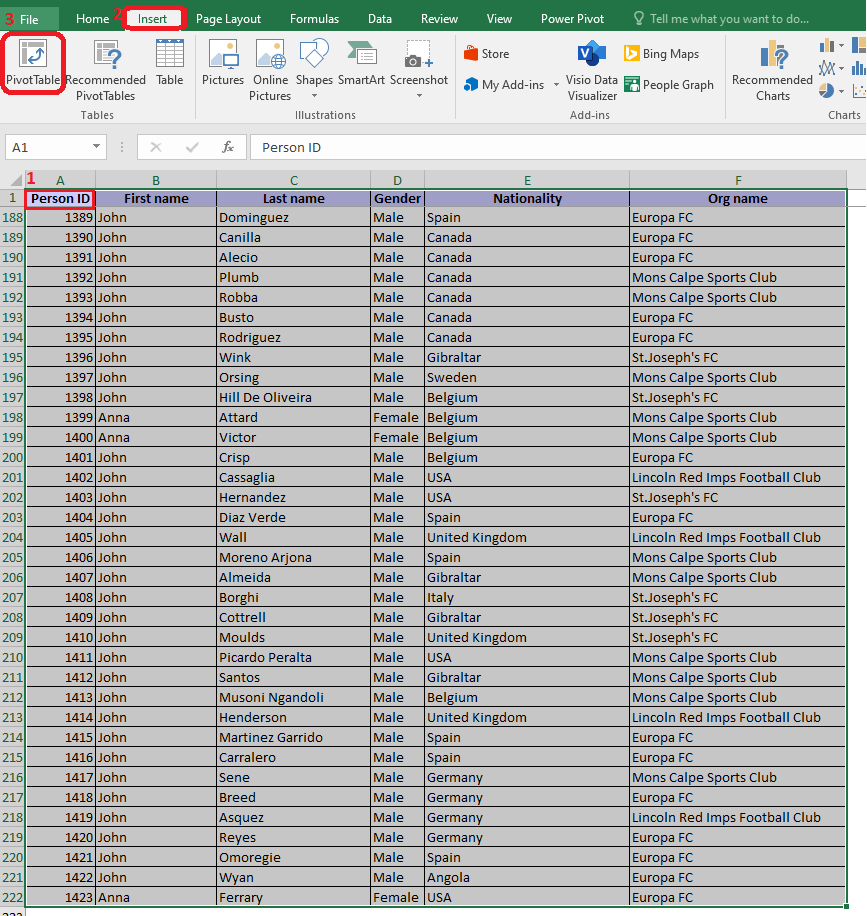
Step 1: Export the Person registrations report and open it in Excel.
-
Step 2: Click on cell A1 and press Shift + CTRL + right arrow® + down arrow ¯ to select the whole table. Then switch to the Insert tab and select the Pivot option in the top left corner.
-
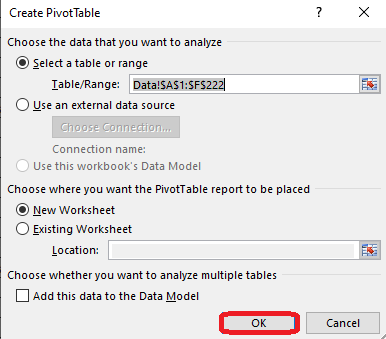
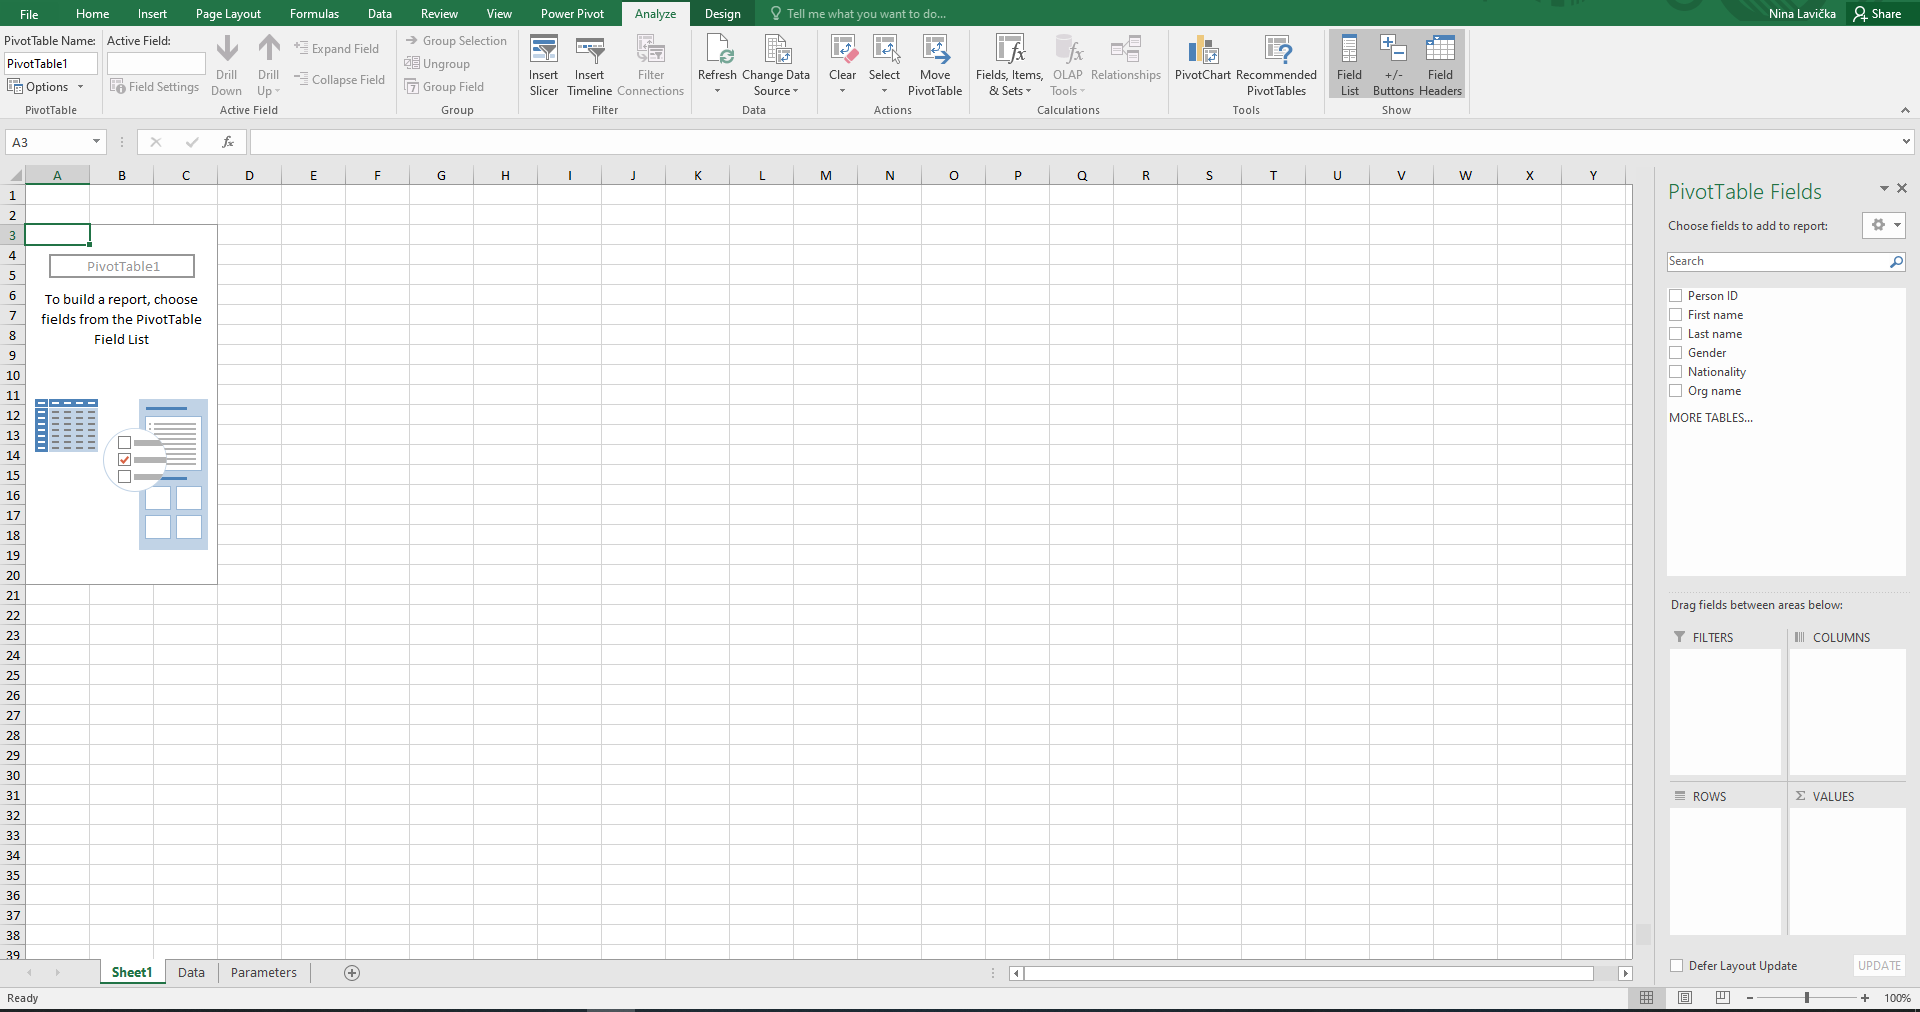
Step 3: Click on the Ok button. A new tab for Pivot analysis will be opened automatically.
-
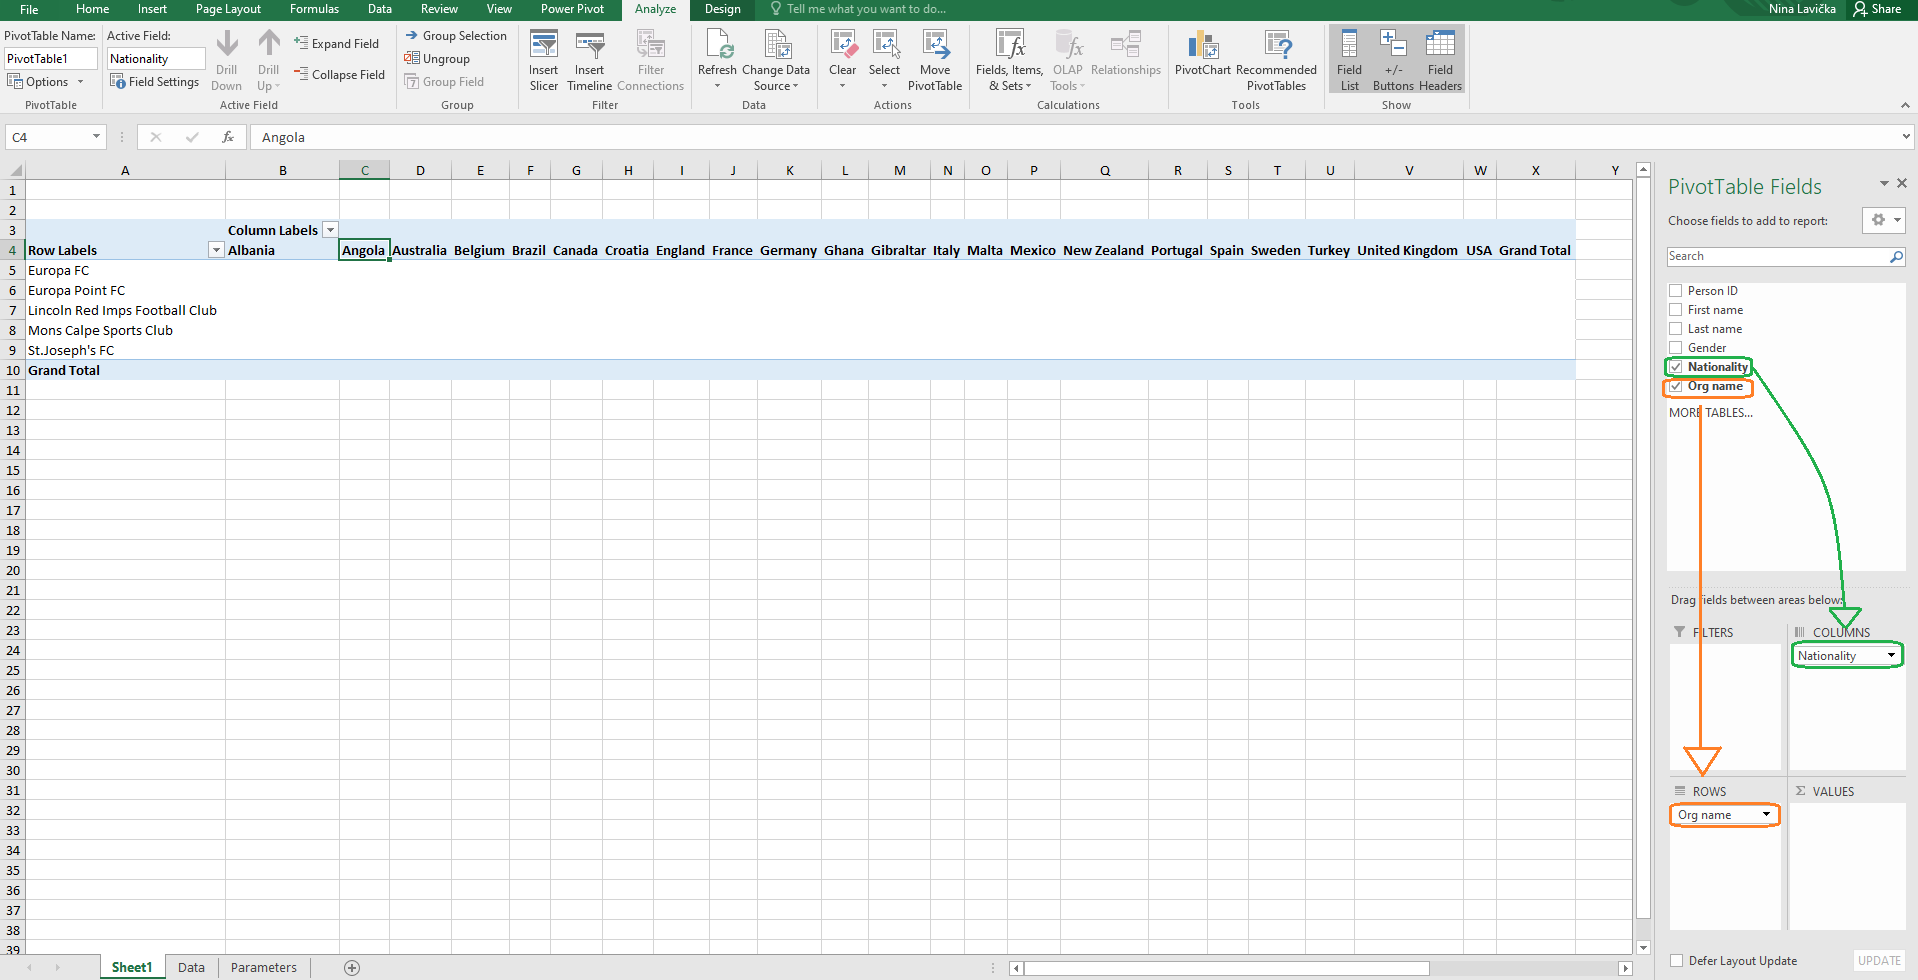
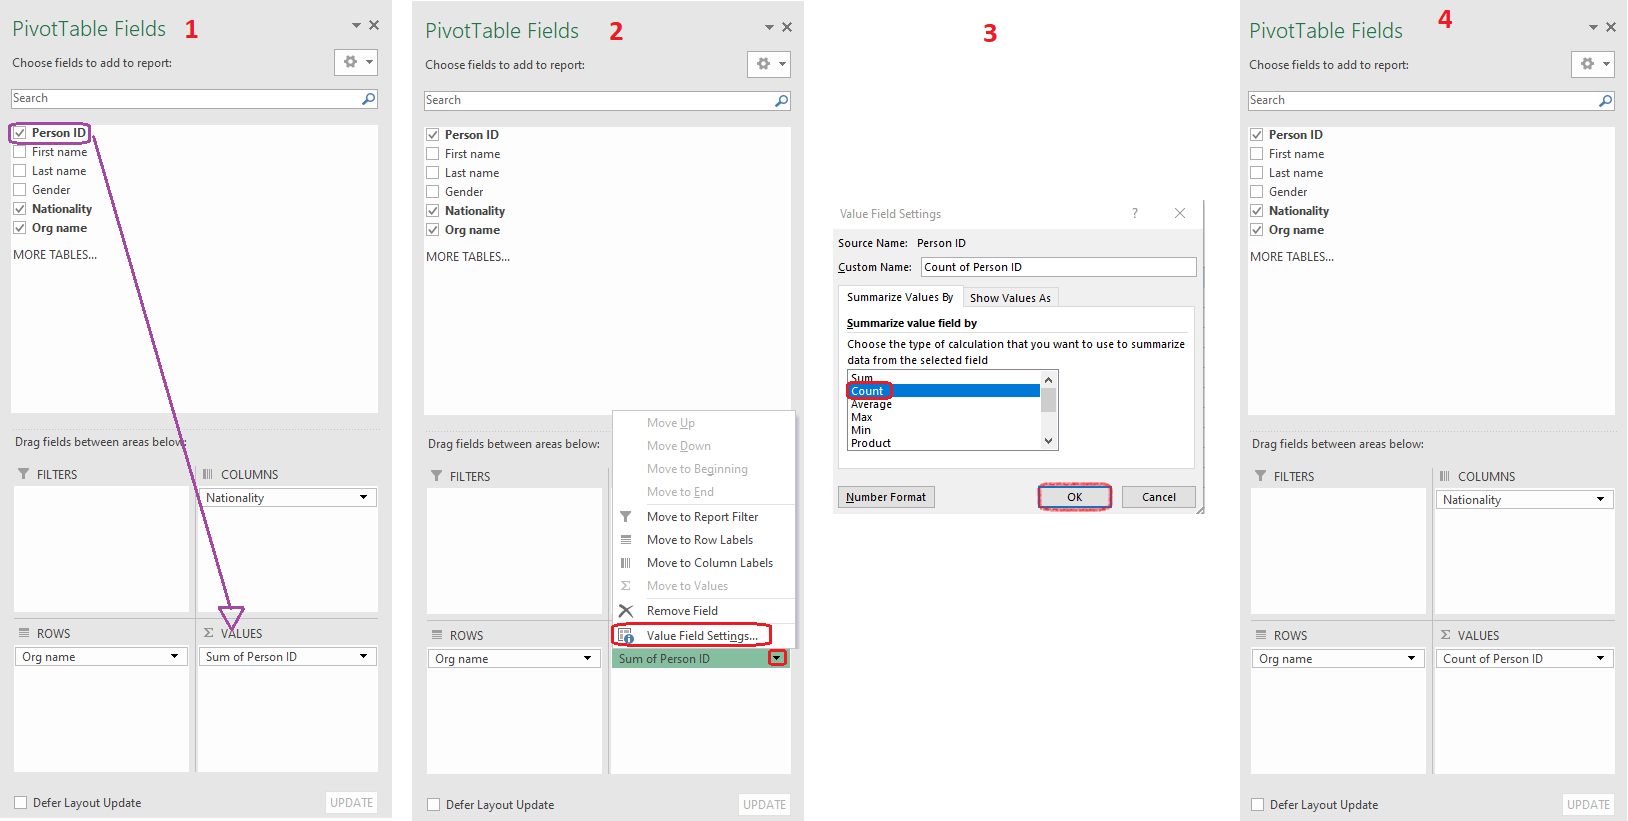
Step 4: Drag and drop Fields (Nationality, Org name) to the Columns (Nationality) and Rows (Org name). You’ll notice that the Clubs are now listed in the table under the Rows, and Nationalities under the Columns.
-
Step 5: Drag and drop the Field (Player ID) to the Values. Since the Sum of Person IDs doesn’t give us the information we're looking for, the next step is to change the Value Field Settings to Count by pressing the little arrow next to the Sum of Person ID.
-
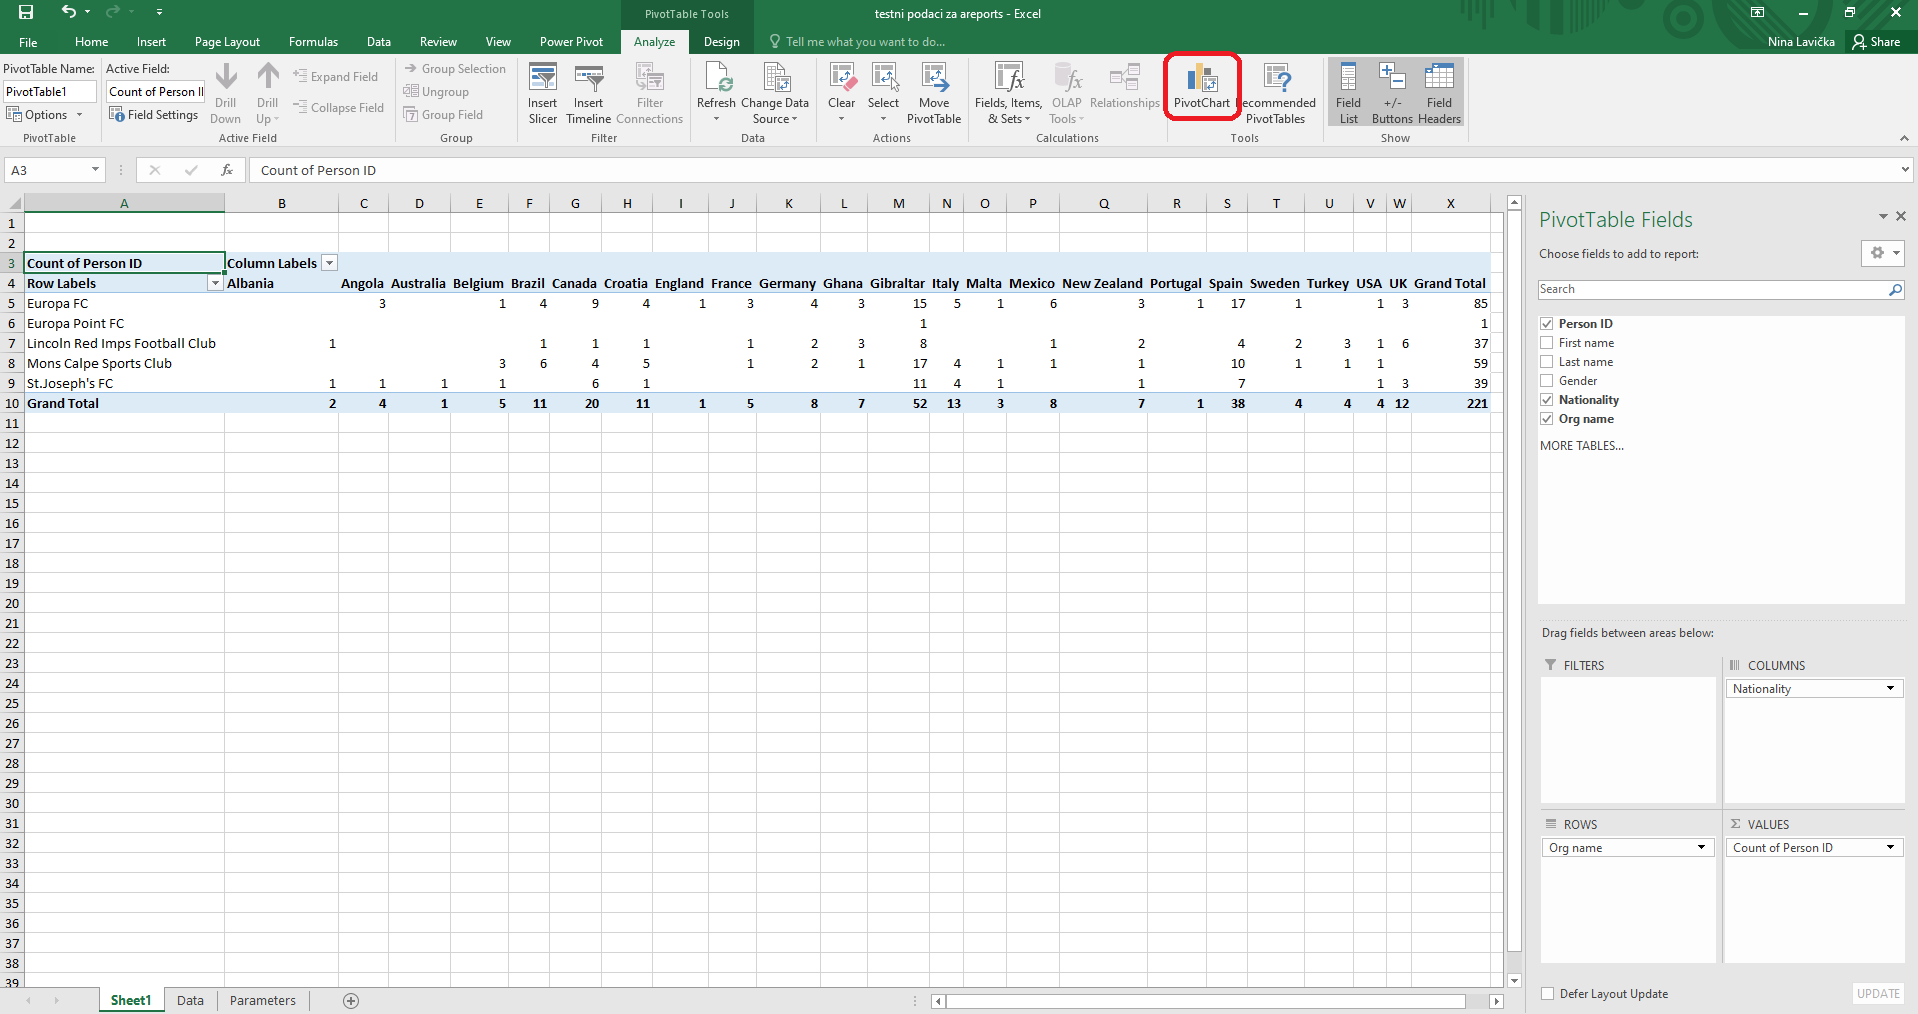
Step 6: If you prefer charts, switch to the Analyze tab and select Pivot Chart. The pivot chart will automatically suggest the chart based on your data.
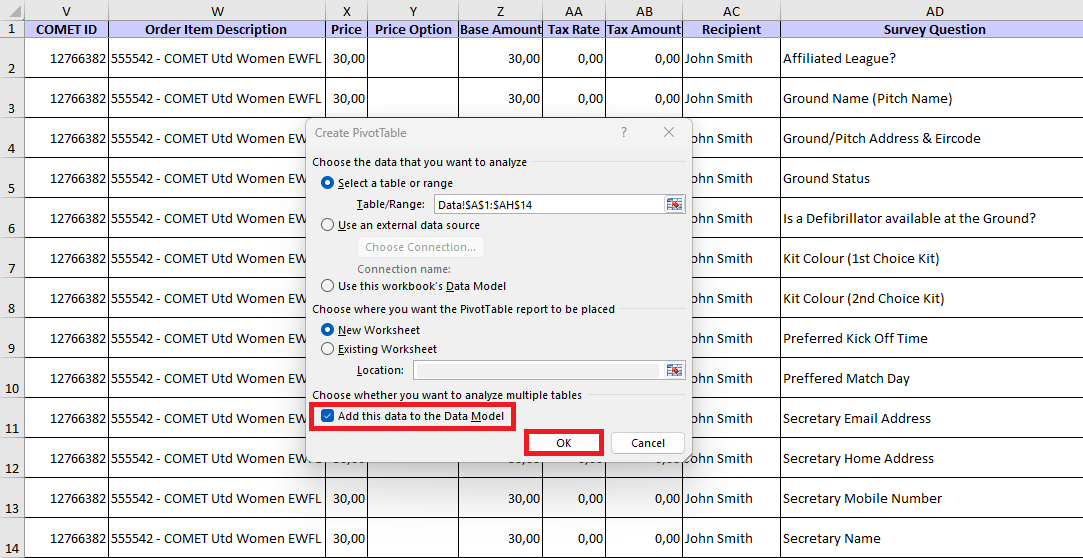
Use of parameter: Add this data to the Data Model
… to see the answers to survey questions in the Order Item Survey Answers.
The "Add this data to the Data Model" option takes your data analysis to the next level. When selected, this parameter adds the dataset to Excel's Data Model, a powerful feature that enables more complex, comprehensive analysis. The Data Model allows users to create relationships between tables, utilize advanced calculations, and build more sophisticated reports.
To continue from Step 3:
-
Step 3: Click on the "Add this data to the Data Model" option and then click the OK button. A new tab for Pivot analysis will be opened automatically.
-
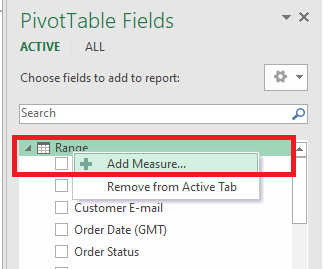
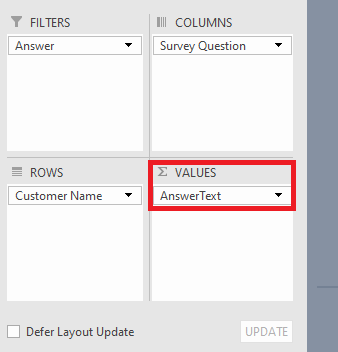
Step 4: If you want to use an actual value instead of Sum, Count, or whatever, you need to create a measure (right-click on Range)
-
Step 5: Put following formula =FIRSTNONBLANK(columnName, ““) in this case (Order Item Survey Answers report) it is =FIRSTNONBLANK(Range[Answer];"")
-
Step 6: And then add this measure as Value
Using CSV files as a data source
COMET reports can be exported not only as Excel files, but also as CSV files. CSV export is particularly useful for large datasets, as it allows exporting report results that exceed Excel’s maximum row limit (1,048,575 rows).
The report result dialog supports exporting to CSV, in addition to exporting to Excel. The CSV export workflow behaves the same as the existing Excel export:
-
If the number of rows is less than 1,000, the file is exported immediately.
-
If the number of rows is greater than or equal to 1,000, the export is processed asynchronously.
-
In this case, the user receives an email containing a download link.
-
The download link expires after 48 hours.
-
Column headings are translated, and data (dates, formats, etc.) is generated in the same way as during Excel export. The exported file has the “.csv” extension.
CSV files can later be opened or imported into Excel and used as a data source for pivot tables and Power Pivot analysis.
Importing multiline CSV files using Data Model
Multiline CSV files can be imported correctly using the Data Model
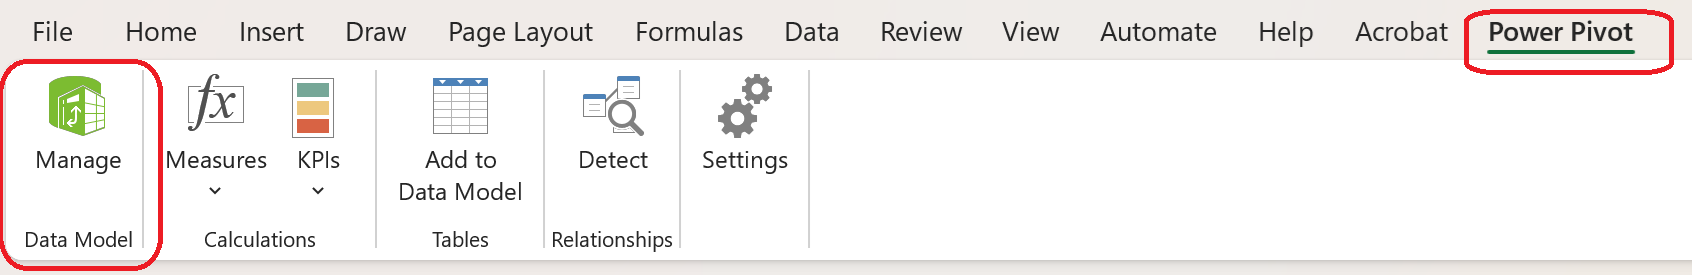
-
First, choose Manage Data Model, either from the Data tab,
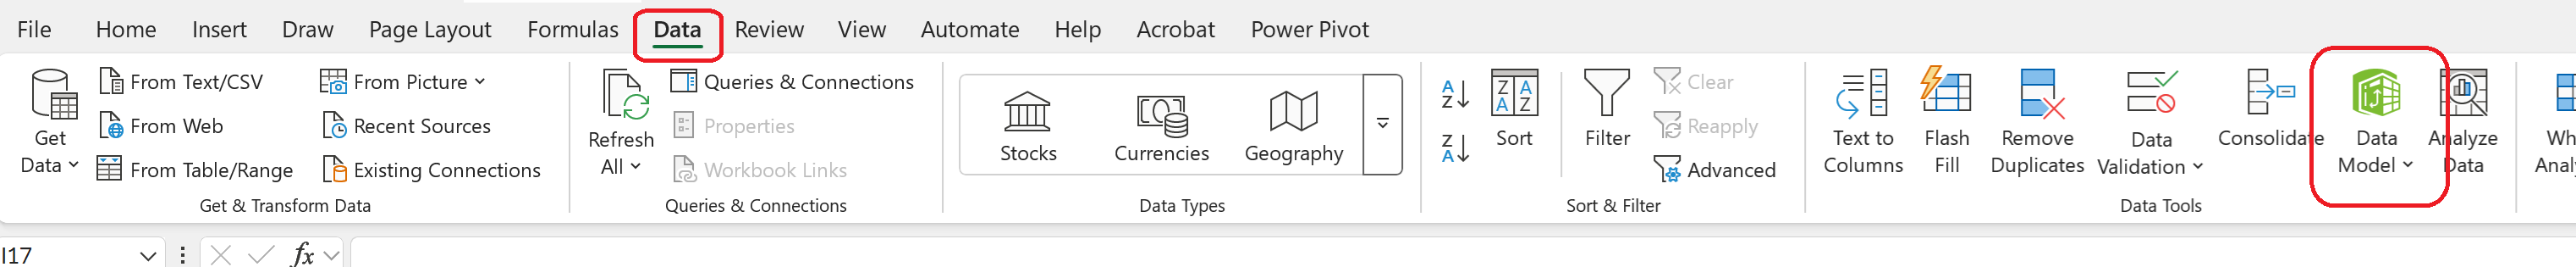
or from the Power Pivot tab.
-
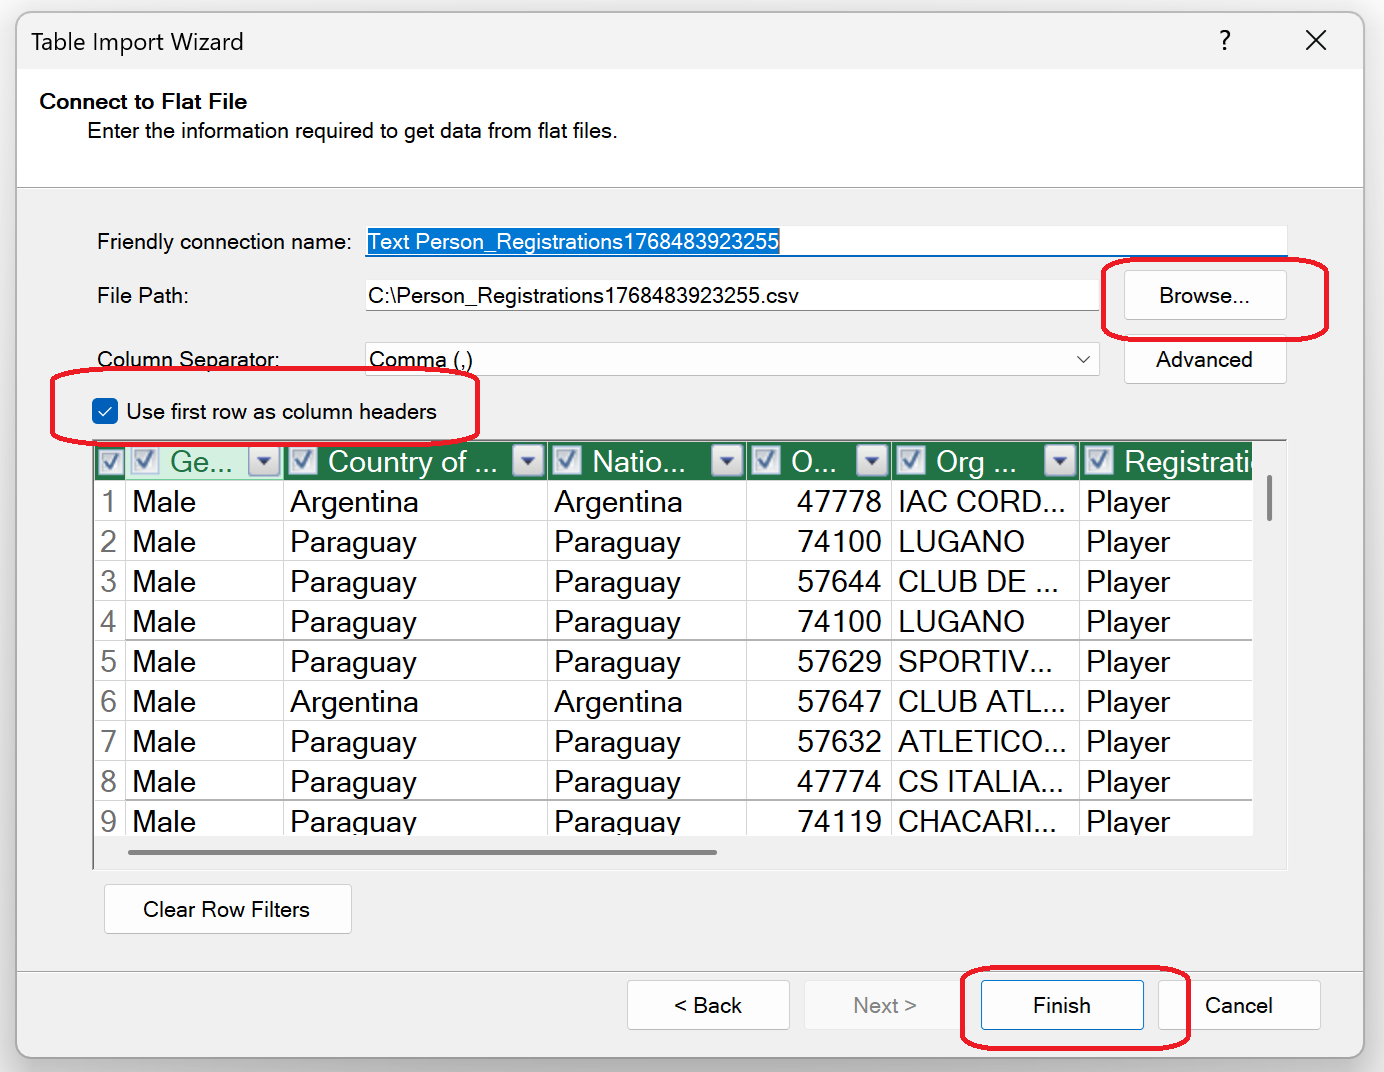
In the newly opened Power Pivot window, click on the same-named button to add data From Other Sources and then choose Text File.
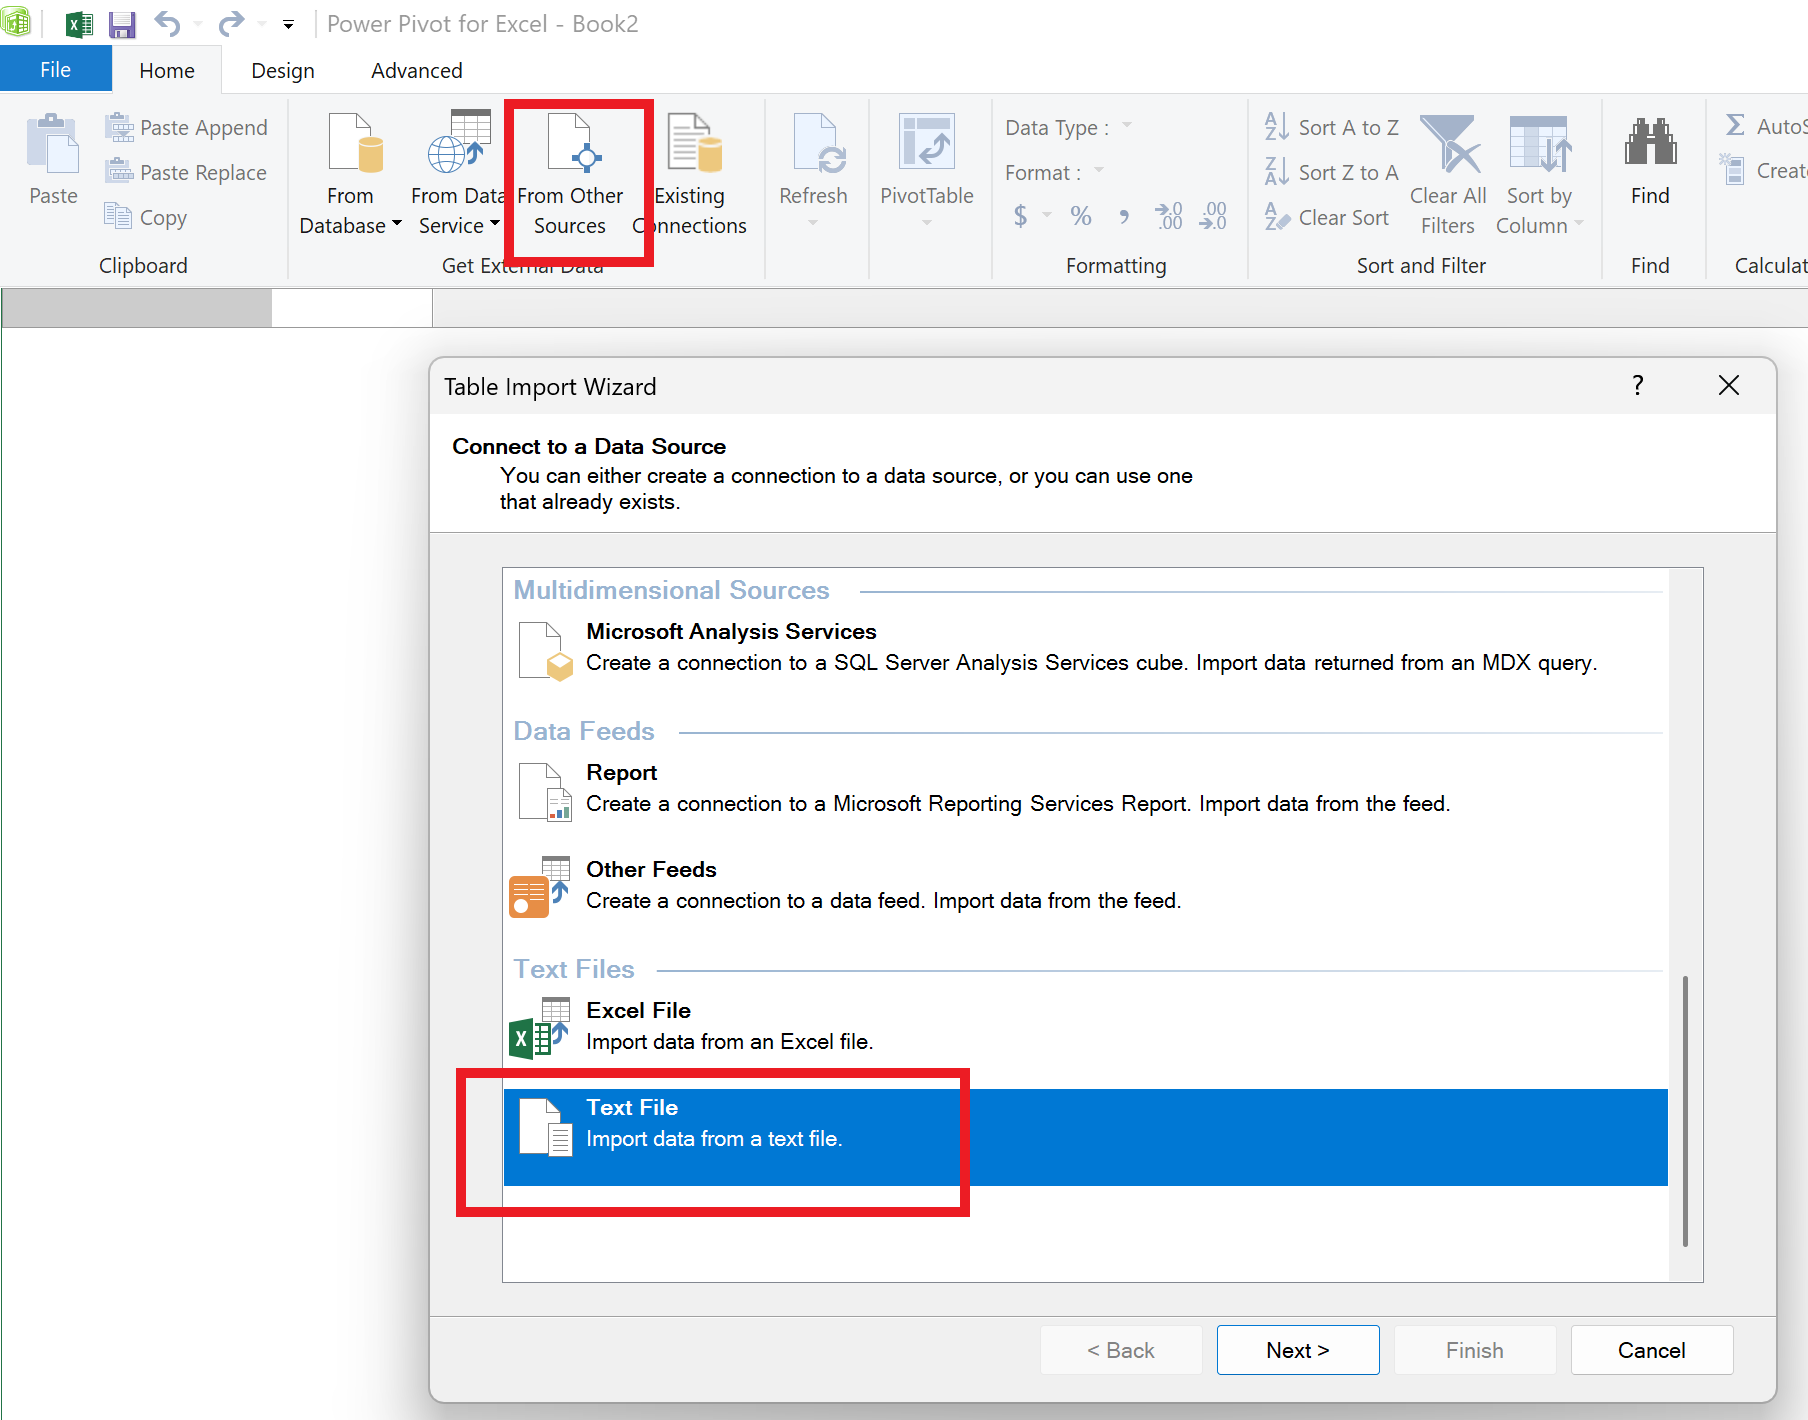
-
Here, you can add any CSV file from your device by clicking on Browse. Make sure you select the Use first row as column headers option, then click Finish.
-
After successful retrieval of all rows into the table, you can create and use a Pivot Table by following the same steps as specified above in this article.
CSV files can contain large amounts of data and may be very large. When working with CSV-based reports, it is recommended to include only the columns needed for the analysis.